 Diabetes In Control. A free weekly diabetes newsletter for Medical Professionals. News and information for Medical Professionals.
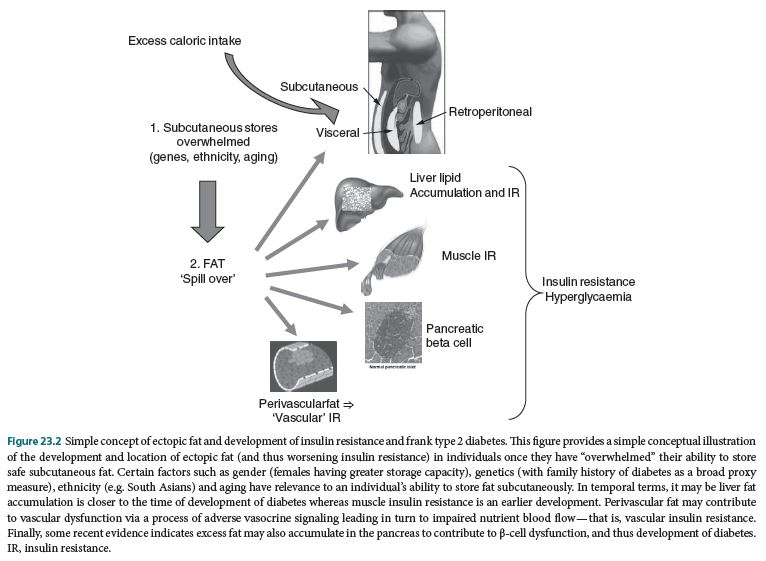
Concept of ectopic fat as a cause of tissue insulin resistance
It appears that individuals prone to T2DM (based in part on their nonmodifiable characteristics) show a greater propensity to accumulate visceral or ectopic fat for a given weight. Interestingly this characteristic, in turn, may be a downstream consequence of “impaired” subcutaneous fat storage capacity, the mechanisms of which deserve further research. As an extreme example of this concept, lipodystrophic individuals have an impaired ability to store subcutaneous fat and, as a consequence, they accumulate fat in visceral and ectopic tissues and so have marked insulin resistance [3]. It is also apparent that certain ethnic groups at heightened diabetes risk may have a tendency to store fat centrally sooner (i.e., at lower average BMI) than European whites and consequently develop diabetes at lower average BMI values and around a decade earlier [4]. At the other extreme, there are many individuals, particularly women, who despite attaining very high BMIs, even as high as 50 to 60 kg m−2, remain insulin sensitive and normolipemic. Imaging studies have shown these individuals to have low levels of visceral and ectopic fat but a high subcutaneous fat content [5]. In other words, the location of fat storage (subcutaneous vs. visceral/ectopic) appears critical as to the BMI and time that an individual develops metabolic complications linked to insulin resistance. Figure 23.2 summarizes the concept of ectopic fat and its importance to insulin resistance.
Pathways linked to insulin resistance
From the preceding observations on the actions of insulin and the role of ectopic fat in exacerbating insulin resistance, a number of linked metabolic perturbances can be predicted. The most clinically relevant and interesting pathways are discussed later with an attempt to draw out potential causal associations where relevant.
Lipid alterations in insulin resistance syndrome
Given insulin’s role in suppressing FFA release, it is clear that insulin resistance must be associated with raised triglyceride levels. Similarly, given that in most individuals triglyceride levels inversely correlate with HDL-cholesterol levels, low HDL-cholesterol is a commonly recognized feature in insulin resistance. Beyond these two changes, it has been clearly shown that higher apolipoprotein B levels and greater preponderance of small dense LDL are linked to insulin resistance [6]. Whilst this lipid pattern is often considered to be linked to increased vascular risk in the prediabetes individual, the causal nature of these associations remains debated. Furthermore, it is now clear that elevated triglyceride levels in most individuals more strongly indicate diabetes than vascular risk [7]. There is also now strong evidence that once cholesterol and HDL-cholesterol are included in cardiovascular risk scores, addition of triglyceride or other lipid fractions adds minimally to prediction of cardiovascular events [8,9]. Despite this, evidence from a large genetic study is potentially consistent with a causal role for triglycerides in heart disease [10]. Thus it is possible for a risk factor to be causal, but offer redundant information in terms of risk scores.
Liver markers and insulin resistance
In terms of chronology, gain of liver fat appears to immediately precede development of diabetes in most individuals whereas muscle insulin resistance appears to be a longer standing and earlier abnormality [11]. Considerable recent work has focused on the role of the liver in the development of diabetes and, linked to this, the condition of nonalcoholic fatty liver disease (NAFLD) has been shown to be very common (>50%) in T2DM and is linked to hepatic insulin resistance [12]. Several factors released by the liver have been associated with insulin resistance as shown in Table 23.2. These include ALT, GGT, SHBG, IGF-1, Ferritin, and CRP [13–17]. In terms of clinical utility, clinicians now commonly recognize the value of ALT and GGT to help define risk of NAFLD. However, whilst ALT and GGT have been shown to be linked to incident diabetes, they are not, and are unlikely to be, included in diabetes risk scores. SHBG is measured in many centers together with testosterone to derive a free androgen index ([testosterone / SHBG]*100), a parameter used in the diagnosis of polycystic ovarian syndrome (PCOS), a condition linked to insulin resistance and obesity [18]. In terms of causality, preliminary evidence suggests SHBG may be causally linked to diabetes [19] but, interestingly, not to insulin resistance. Further basic and clinical work in this area would be useful to tease apart the causal pathway.
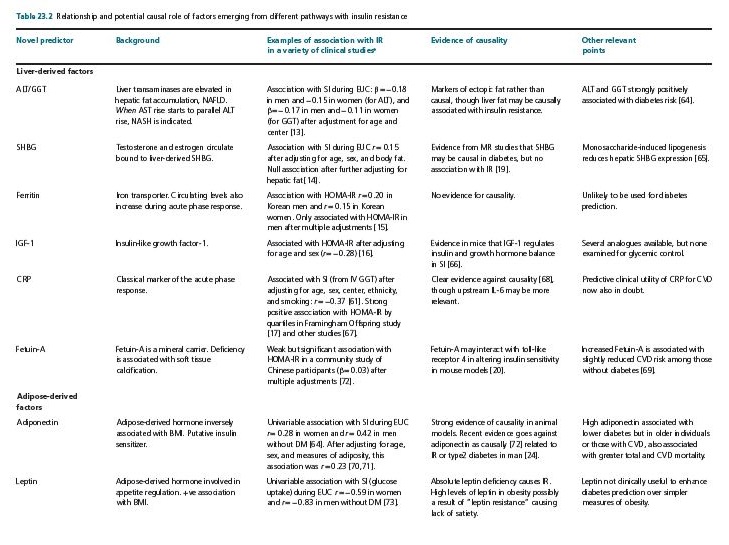

Fetuin-A (also called alpha-2-HS-glycoprotein) is a liver derived glycoprotein involved in calcium and phosphate transport. Recent evidence indicates that Fetuin-A may be implicated in insulin sensitivity through inflammatory signaling pathways [20]. Consequently clinical and epidemiologic studies of circulating levels of this biomarker, and its implications for disease, are now emerging.